NATURAL CAPITAL
Strategy - Concern for the Environment
Today, when the world is beset with problems such as global warming, the environment is something we cannot afford to ignore. The Bank takes a holistic view of value creation and incorporates environmental considerations into all its activities. Projects we fund are screened for their environmental impacts and how they can be mitigated.
We are highly conscious of the impact we leave on the environment. We strive to minimize waste and reduce resource consumption in all manners possible.
Our Carbon Footprint
We take pride in the fact that as an environmentally-conscious organization, we carefully track the impact of our internal activities. As we have done in the previous years, we are reporting our greenhouse gas emissions (GHG), using the most recent version of WBCSD/WRI Greenhouse Gas Protocol Accounting and Reporting Standard (2004) and Calculation Tools (2015).
In keeping with the matters elaborated on in this section of the Annual Report the boundary is limited to the Bank and its core business. Hence we have restated the figure for Scope 2 electricity for 2015 to enable comparison. Our reporting of GHG emissions under Scope 3, which is optional is limited to sources that are material and measurable.
GHG Emissions of the Bank
| Scope |
Source |
2016 |
2015 |
| |
|
tCO2e |
% |
tCO2e |
% |
| 1 |
Combustion in stationary sources |
4.4 |
0.1 |
4.4 |
0.2 |
| 1 |
Combustion in mobile sources |
149.2 |
4.5 |
55.4 |
1.8 |
| 1 |
Fugitive emissions from air conditioning equipment |
101.2 |
3.1 |
101.2 |
3.4 |
|
Subtotal, Scope 1 |
254.8 |
7.7 |
161.0 |
5.4 |
| 2 |
Purchased electricity |
1,340.7 |
40.4 |
1,297.9 |
43.1 |
|
Subtotal, Scopes 1 and 2 |
1,595.4 |
48.0 |
1,459.0 |
48.4 |
| 3 |
Combustion in stationary sources |
83.4 |
2.5 |
55.5 |
1.8 |
| 3 |
Purchased electricity |
1,590.6 |
47.9 |
1,444.9 |
48.0 |
| 3 |
Employee air travel |
52.2 |
1.6 |
52.7 |
1.8 |
|
Subtotal, Scope 3 |
1,726.2 |
52.0 |
1,553.1 |
51.6 |
|
Total, all Scopes |
3,321.6 |
100.0 |
3,012.1 |
100.0 |
Note: Totals may not tally exactly due to rounding
The total carbon footprint of the Bank amounted to 3,322 tonnes carbon dioxide equivalent (tCO2e), which was an increase of 10.3 % over 2015. The primary cause of the increase is the fuel consumption in vehicles owned by the Bank in branches owned by the Bank, a scope 1 item. The branch network expanded during the year, by the addition of 11 new branches, to widen the Bank’s reach.
Purchased electricity by far was the largest source of GHG emissions. Of this, our own premises (banking business only) contributed 40.4% and another 47.9% was generated by premises rented by the Bank. This high proportion is natural considering the nature of the business.
GHG Emissions Intensity
When emissions are considered related to activity levels, our overall GHG emissions intensity in 2016 was 253 kg tCO2e per LKR million of the Bank’s total operating income (2015: 247kg tCO2e per LKR million). Taking into account only scopes 1 and 2, which is a more appropriate figure for benchmarking, the Bank’s GHG emissions intensity in 2016 was 212 kg tCO2e per LKR million (2015: 119kg tCO2e per LKR million).
Looking into the future, we highlight the importance of closely managing electricity consumption through steps such as increasing energy efficiency in plant equipment and buildings augmented by internal power generation through solar PV. Thereby we will enhance the Bank’s environmental record while also being more cost effective by effective and efficient resource consumption.
Paper consumption
The Bank in collaboration with an accredited recycler makes every effort to maximize the recycling of waste paper generated by its day-to-day operations. The waste reduction and recycling programme of the Bank resulted in waste paper amounting to 22,276 kgs being recycled; this in turn means that there was an estimated reduction in GHG emissions of 22,276 kgs of carbon equivalent and saved:
- 379 trees
- 39,094 litres of oil
- 89,104 kwh of electricity
- 707,931 litres of water
- 67 cubic metres of land fill
Environmental Friendly Initiatives
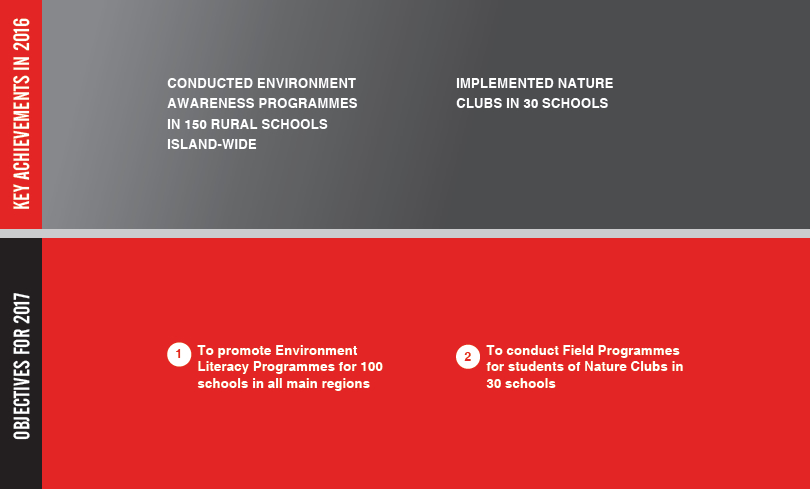
The Bank also reinforced its commitment to the environment during the year by the Environment Literacy for Schools programme. This programme covered a total of 150 rural schools and also resulted in the formation of nature clubs in 30 schools. Further details are given on pages 101 to 109 under Social and Relationship Capital.
