Operating Environment
In the global frontier, China demonstrated satisfactory growth. The United Kingdom too, grew stronger than expected in the aftermath of the Brexit.
The Global Economy
Source: World Economic Outlook (January 2017) of the International Monetary Fund.
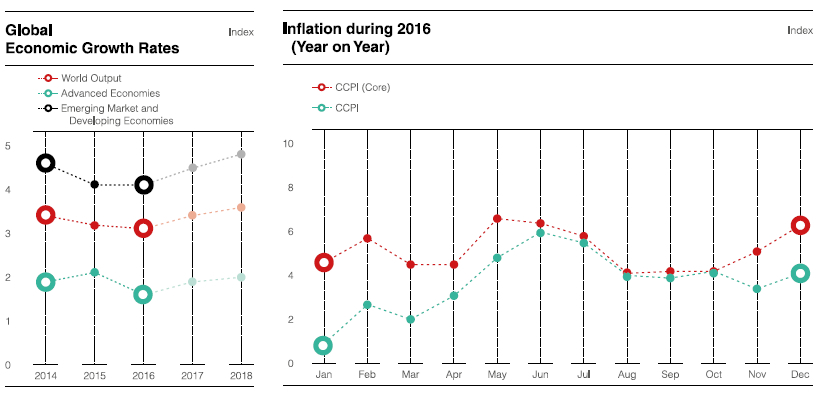
The global economy recorded a somewhat satisfactory performance in 2016, with an estimated growth of 3.1%. However, there were wide disparities in the performance between different country groups.
The advanced economies performed somewhat better than expected due to a reduced drag from inventories and recovery in manufacturing. The U.S. economy picked up strongly in the second half of the year, achieving near full employment. Japan too outperformed expectations. However several economies in the Euro area did not fare too well, with some exceptions such as Spain and the U.K. in the aftermath of Brexit.
The record of emerging economies was patchy. The Chinese economy, bolstered by policy stimulus, overcame some of the uncertainties of the past and showed satisfactory growth. Higher and more stable oil prices also propped up the Russian economy. However, some emerging economies such as Argentina, Brazil and Turkey did poorer than expected.
Agreements among major suppliers to curtail oil production resulted in higher prices in end December 2016 – early January 2017. With commodity prices reaching their trough, headline inflation rates have reduced in the last months of the year. Core inflation rates, however, have remained largely the same and generally below their targets.
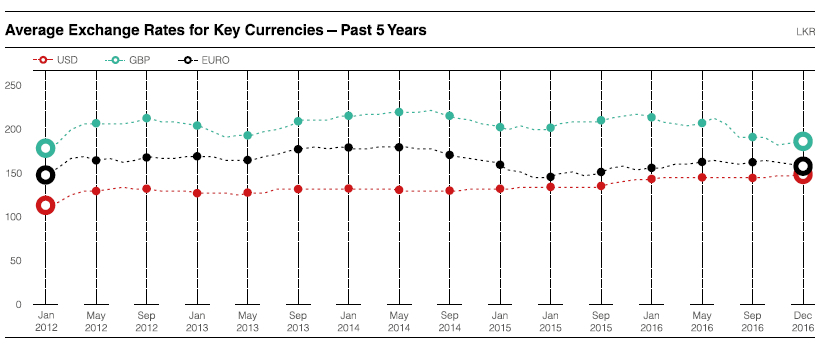
Regarding financial markets, long-term real and nominal interest rates have shown an upward trend since August 2016. This was aggravated after the U.S. Presidential election in November, driven by expectations of a change in the U.S. policy mix. The US Dollar has also appreciated against key currencies since August 2016 by over 6%. Some of the other advanced economies, which are commodity exporters have also seen an appreciation in their currencies; on the other hand the Euro and Japanese Yen have weakened.
Looking forward to 2017, some acceleration is expected in advanced economies as well as in emerging/developing economies. The expected growth rates for 2017 and 2018 are 3.4% and 3.6% respectively.
Global Economic Growth Rates – Past and Future
| |
|
|
Estimate |
Projections |
| % |
2014 |
2015 |
2016 |
2017 |
2018 |
| World Output |
3.4 |
3.2 |
3.1 |
3.4 |
3.6 |
| Advanced Economies |
1.9 |
2.1 |
1.6 |
1.9 |
2.0 |
| United States |
2.4 |
2.6 |
1.6 |
2.3 |
2.5 |
| Euro Area |
0.9 |
2.0 |
1.7 |
1.6 |
1.6 |
| Japan |
0.0 |
1.2 |
0.9 |
0.8 |
0.5 |
| United Kingdom |
3.1 |
2.2 |
2.0 |
1.5 |
1.4 |
| Emerging Market and
Developing Economies |
4.6 |
4.1 |
4.1 |
4.5 |
4.8 |
| China |
7.3 |
6.9 |
6.7 |
6.5 |
6.0 |
| India |
7.2 |
7.6 |
6.6 |
7.2 |
7.7 |
| ASEAN |
4.6 |
4.8 |
4.8 |
4.9 |
5.2 |
The Sri LankanEconomy
Source: Central Bank of Sri Lanka publications
The Sri Lankan economy showed moderate performance in the first nine months of 2016, with a growth rate of 4%, compared with 4.8% in 2015. However, it is noteworthy that this growth was recorded despite a contraction in the agricultural sector of 2.5% in the first half of the year. This however, was compensated by a growth in the industrial and service sectors of 5.2% and 4.9% respectively in the same period. The main contributor to the growth in services was the financial services sector. Unemployment during the first half of 2016 was 4.4%, a modest improvement over the 4.6% in the corresponding period the previous year.
Despite some upward pressures, inflation was moderate in 2016. Inflation was mainly driven by adverse weather (on the supply side) and Government tax policy. Relaxation in monetary policy and increases in wages contributed to demand pressure on inflation.
The overall impact was that headline inflation, as measured by the year on year change in the Colombo Consumers’ Price Index (CCPI) was 4.1% in December 2016 (December 2015: 2.8%). Core inflation, based on CCPI, increased to 6.3% year on year, at end 2016 (2015:4.5%). Overall inflation has been restrained, being in mid single digit figures of 4-6%.
The Central Bank of Sri Lanka (CBSL) tightened its monetary policy stance during the first nine months of the year. This was with the view to contain the possibilities of demand driven inflationary pressure which could result from high credit growth and excessive monetary expansion. Reflecting the effects of the tightened monetary policy, market interest rates moved upwards during the first nine months of the year, which appeared to have stabilized over the end of the year.
Credit granted to the private sector by the commercial banks decelerated towards the latter part of the year. The year-on-year growth in credit granted to the sector which was as high as 28.5% in July 2016 reduced to a growth rate of 21.1% in November 2016. In absolute terms, credit to the private sector increased by LKR 81.3 billion in November 2016 compared to LKR 79.0 billion in October 2016.
External Trade performance was modest during the year, with improved performance recorded towards the end of the year. During the first eleven months of 2016, earnings from exports declined by 2.7%, whereas expenditure on imports increased by 1.7%. The net result was an increase in the cumulative trade deficit up to USD 922 million by end November 2016.
The savings – investment gap was narrowed during the first nine months of 2016 by earnings from tourism and remittances from expatriate workers, which contributed to a lower current account deficit. The Government securities market showed a net outflow of foreign investment; conversely there was a net inflow of long term loans to the Government. The Government also entered into a three year Extended Fund Facility (EFF) of SDR 1.1 billion (approximately USD 1.5 billion) with the IMF. This is expected to strengthen the external position of the country and facilitate the broad economic policies of the Government. The gross official reserves were estimated to be around USD 6.0 billion by end 2016.
Notwithstanding considerable depreciation pressure on the Rupee during the first part of 2016, on the whole it was relatively stable during the year. The Rupee depreciated by 3.8% against the US Dollar in 2016. Depreciation pressure on the Rupee was caused by import expenditure, debt service payments and unwinding of investments in the Government securities market during the first four months of 2016. The Central Bank intervened in the domestic foreign exchange market to counteract the depreciation pressure by supplying foreign currency liquidity.
Fiscal sector showed an improved performance during the first ten months of 2016. Total fiscal revenue increased to 10.8% of estimated GDP during the first ten months of 2016, from 9.7% during the same period in 2015.
Total expenditure and net lending during the first ten months of 2016 increased to 15.3% of estimated GDP from 15.1% in the previous year. Overall budget deficit declined to 4.4% of estimated GDP during the first ten months of 2016 in comparison to 5.4% of GDP during the same period of 2015.
Looking Ahead
The Sri Lankan economic growth rate is forecast to be around 5.0%-5.5% for 2016. The growth rate is expected to increase to 6.3% in 2017, with the expectation for it to grow at an annual rate of 7% or above. Growth in the trade of merchandise goods and services; especially in the areas of tourism, transport, telecommunication, ports and financial services are expected to be major contributors towards this growth.
The medium term growth will be supported by the consolidation of the private and public sector investments. Larger inflows of foreign investment, especially in areas where Sri Lanka boasts of a comparative advantage such as information technology related services and logistics, are expected. Considerable investment is also expected from China in the proposed Special Economic Zone in Hambantota. Other key areas that are expected to drive growth in the medium-term are the establishment of the Colombo International Financial City and new opportunities under the Megapolis project. With the contribution from these developments, encompassing all sectors of the economy, we can be optimistic about the country achieving upper middle income status with a per capita income of over USD 5,500 by 2020.
The Government expects to put in place the supporting structures for such growth, with the assistance of the Central Bank, by a three pronged macroeconomic strategy. The long standing deficiencies in the budgetary operations in the fiscal framework will be addressed, to strengthen fiscal sustainability in the medium-term. Second, a more flexible information targeting framework will be crafted through a more robust monetary policy. Finally, exchange rate management will be reformed through a well-designed and widely accepted framework, to move towards a market based exchange rate.
Under the CBSL’s enhanced monetary policy framework, the CBSL would follow a dual strategy aimed at stabilising inflation in mid single digits over the medium-term, whilst facilitating growth objectives and flexibility in exchange rate management.
Sri LankanBanking Sector
Source: Central Bank of Sri Lanka publications
Despite impediments due to various domestic and international macro-economic developments, the Sri Lankan banking sector proved resilient and performed well during the year. The total assets base of the industry exceeded LKR nine trillion. Given below are some key highlights of the industry for 2016.
- 32 licensed banks, with a solid network of 3,614 branches
- Over LKR 700 billion in capital funds
- Over LKR 2.3 trillion in total investments
- Over LKR 100 billion in profits
- An employee strength of 55,257
Banking sector KPIs
| |
2016 |
2015 |
Movement |
| Return on assets (%) |
1.4 |
1.3 |
|
| Return on equity (%) |
17.3 |
16.2 |
|
| Capital adequacy ratio (%) |
14.1* |
15.4 |
|
| Risk-weighted assets (LKR billion) |
4,900* |
4,288 |
|
| Statutory liquid asset ratio (%) |
30.0 |
33.9 |
|
| Non-performing loan ratio (%) |
2.6 |
3.2 |
|
| Total provision coverage ratio (%) |
70.2 |
62.3 |
|
| Net interest margin (%) |
3.6 |
3.6 |
|
| Operating efficiency ratio (%) |
49.3 |
51.0 |
|
*As at 30 September 2016
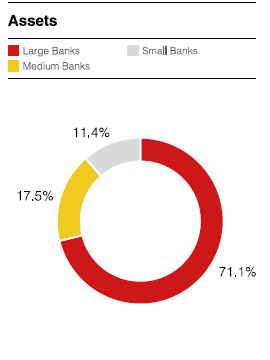
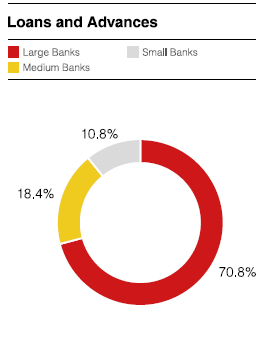
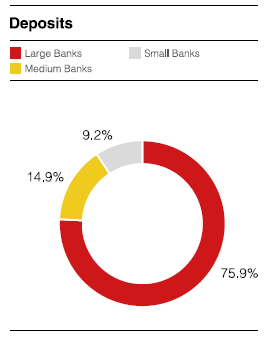
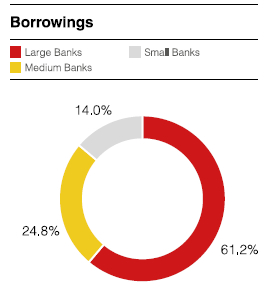
Contribution within the Sector by Large, Medium and Small Banks
The 32 licensed banks of the country have been classified in to large, medium and small banks, based on the asset base of the banks by the Central Bank of Sri Lanka. Accordingly, the industry included six large banks, whose assets were in excess of LKR 500 billion. Five banks were classified as medium with assets in the range of LKR 200 – 500 billion. 21 banks were classified in the small banks category, with assets of less than LKR 200 billion.
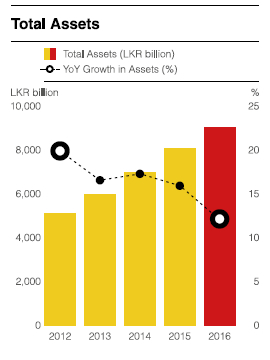
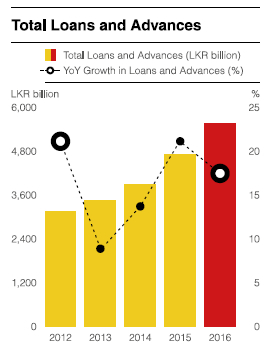
Depicted in the graphs are how total assets, loans and advances, deposits and borrowings of the industry were shared amongst the three classifications of banks.
Banking Sector Performance
Total assets – As was mentioned before, the total assets of the banking sector grew by 12% and reached LKR 9,047 billion by end 2016. This was an increment of LKR 970 billion.
Loans and advances – Total loans of the banking sector was LKR 5,541 billion, as at end 2016 and this was a result of a 17.5% growth over the prior year. Loan growth in 2016 was lower than 2015 (21.1%), reflecting the economic conditions that prevailed in the country during the year. Consumption oriented lending was 20.7% of the total loans, followed by lending to the construction sector (17.8%) and trading (14.0%).
Loans granted to the SME sector as a percentage of total loans has increased from 15.1% in 2015 to 16.2% in 2016 (30 September 2016), affirming the banking industry's commitment to empowering this sector.
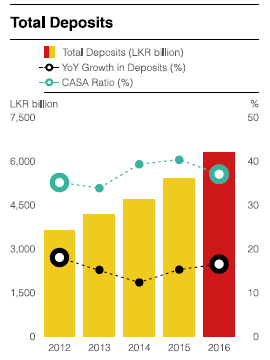
Deposits growth – Deposits grew faster than in 2015, with a growth rate of 16.5% in 2016 (2015:15.3%). Time deposits accounted for the bulk of total deposits (60.6%), continuing the historic trend of product-wise deposits composition. There was a notable decrease in the CASA ratio in the industry from 40.3% in 2015 to 37.1% in 2016.
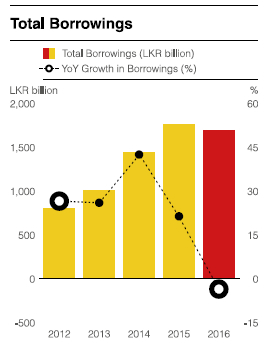
Banking sector borrowings – Banking sector borrowings, as at end 2016, was LKR 1,696 billion, which reflected a 3.5% reduction over the prior year. This reduction was a Rupee equivalent of LKR 62 billion. Within total borrowings, foreign currency borrowings decreased by USD 319 million (-4.4%). Rupee borrowings decreased by 2.1%, a Rupee equivalent of LKR 14.2 billion.
Way Forward
The CBSL has also put forward proposals to achieve increased soundness, efficiency and stability of the financial system. The supporting pillars for this are regulation and supervision of all major categories of financial institutions, ensuring sound and safe payment and settlement systems, robust risk management systems and instilling good corporate governance standards and practices in the financial sector, while promoting financial inclusion.
The CBSL also intends to strengthen the capital position of the banks in conformance with minimum requirements and BASEL III capital standards.
Amongst many other initiatives, the CBSL also envisages enhancing mandatory disclosures and transparency through the introduction of a new regulatory framework for the preparation, presentation and publication of the annual and quarterly financial publications.
The Bank welcomes all these initiatives and will be congruent with them in the conduct of its business.