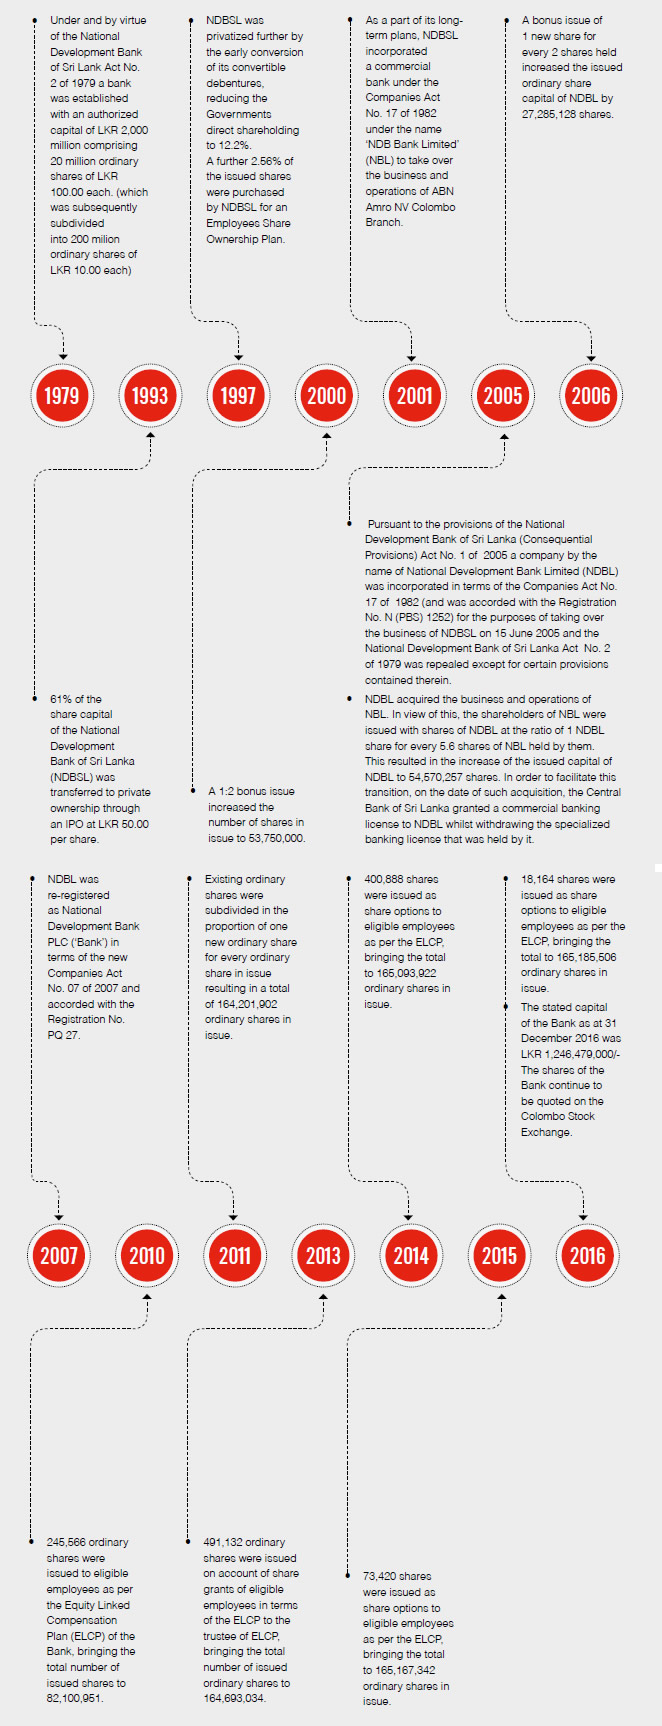
2016 was a comparatively better year than 2015 for the main global equity markets, amidst the significant events that occurred changing the global political, social and economic landscape. Britain’s referendum to leave the EU and Donald Trump’s presidential election victory were two main political surprises that shook the investment markets. On the monetary policy front, the US Federal Reserve’s decision to raise rates after 12 months in December 2016 was received with mix sentiments by the capital markets. The MSCI World index recorded a gain of 4.5% for 2016 recovering from the shocks of the major events that took place. The main global equity markets performed well recording gains in several key indices such as S&P 500-USA (+9.5%), FTSE 100-UK (+14.4%) and S&P ASX 200-Australia (+7.0%). Meanwhile, the Shanghai Shenzen CSI 300 index-China recorded a loss of 12.31%.
During 2016, the All Share Price Index (ASPI) dropped 9.7% whilst S&P SL20 index also declined by 3.6%. The equity market activity remained subdued throughout the year recording an average daily turnover of LKR 737 million (LKR 1,060 million in 2015). A significant drop in ASPI as well as S&P SL20 was witnessed in the first quarter of 2016 due to tax proposals taking a toll on investor confidence coupled with the fed rate hike initiated almost after a decade in December 2015. A short-lived upward trajectory in indices was witnessed in the month of April with the confirmation of the IMF Extended Fund Facility (IMF EFF) to Sri Lanka. Although a net foreign outflow of LKR 6.3 billion was recorded for the first half of 2016, renewed interest from foreign investors was observed in the backdrop of the receipt of IMF EFF that led to net foreign inflow of LKR 6.7 billion in the second half of 2016.
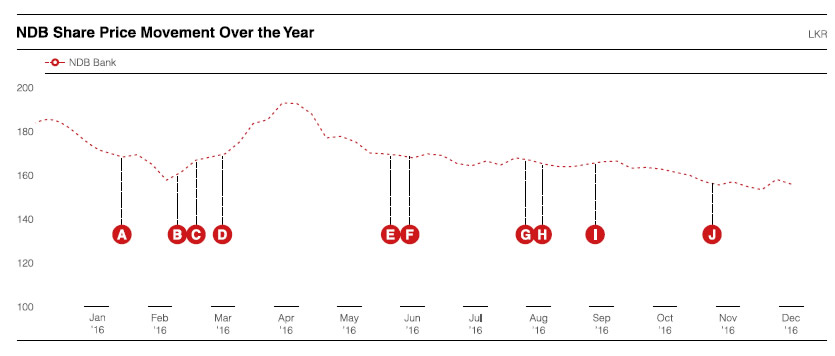
The NDB share price declined by 19.6% to close at LKR 156.00 by end of 2016. During the year, the share reached a high of LKR 199.90
(in May 2016) and a low of LKR 150.00 (in November 2016). The NDB share performance was mainly impacted
from the Fitch Rating downgrade from AA-(lka) to A+(lka) and the resignation of the CEO coupled with fiscal tightening measures which adversely affected the counters across the Board especially, the banking sector.
|
As at 31 December 2016 |
As at 31 December 2015 |
| Shareholding Range |
No. of Shareholders |
% |
No. of Shares |
% |
No. of Shareholders |
% |
No. of Shares |
% |
| 1 – 1,000 |
5,362 |
66.64 |
1,734,576 |
1.05 |
5,245 |
66.30 |
1,728,113 |
1.04 |
| 1,001 – 10,000 |
2,219 |
27.58 |
7,068,295 |
4.28 |
2,236 |
28.27 |
7,110,788 |
4.31 |
| 10,001 – 100,000 |
382 |
4.75 |
10,588,434 |
6.41 |
346 |
4.37 |
9,317,220 |
5.65 |
| 100,001 – 1,000,000 |
58 |
0.72 |
16,400,419 |
9.93 |
56 |
0.71 |
18,440,324 |
11.16 |
| Over 1,000,000 |
25 |
0.31 |
129,393,782 |
78.33 |
28 |
0.35 |
128,570,897 |
77.84 |
| Total |
8,046 |
100.00 |
165,185,506 |
100.00 |
7,911 |
100.00 |
165,167,342 |
100.00 |
3.2 Resident/Non-Resident Shareholding
|
As at 31 December 2016 |
As at 31 December 2015 |
| Shareholding |
No. of Shareholders |
% |
No. of Shares |
% |
No. of Shareholders |
% |
No. of Shares |
% |
| Resident |
7,912 |
98.33 |
137,992,077 |
83.54 |
7,759 |
98.08 |
114,170,880 |
69.12 |
| Non-Resident |
134 |
1.67 |
27,193,429 |
16.46 |
152 |
1.92 |
50,996,462 |
30.88 |
| Total |
8,046 |
100.00 |
165,185,506 |
100.00 |
7,911 |
100.00 |
165,167,342 |
100.00 |
3.3 Individual/Institutional Shareholding
|
As at 31 December 2016 |
As at 31 December 2015 |
| Shareholding |
No. of Shareholders |
% |
No. of Shares |
% |
No. of Shareholders |
% |
No. of Shares |
% |
| Individual |
7,600 |
94.46 |
44,772,715 |
27.10 |
7,479 |
94.54 |
37,048,619 |
22.40 |
| Institutional |
446 |
5.54 |
120,412,791 |
72.90 |
432 |
5.46 |
128,118,723 |
77.60 |
| Total |
8,046 |
100.00 |
165,185,506 |
100.00 |
7,911 |
100.00 |
165,167,342 |
100.00 |
4. Twenty Largest Registered Shareholders of the Bank as at 31 December 2016 as per Rule No. 7.6 (iii) of the Listing Rules of the Colombo Stock Exchange
| 2016 |
2015 |
| |
Name |
No. of Shares |
% |
Name |
No. of Shares |
% |
| 1 |
Bank of Ceylon No. 1 Account |
16,371,076 |
9.91 |
Bank of Ceylon No. 1 Account |
16,371,076 |
9.91 |
| 2 |
Employees‘ Provident Fund |
16,010,248 |
9.69 |
Employees’ Provident Fund |
16,010,248 |
9.69 |
| 3 |
R S Captain |
13,476,049 |
8.16 |
Sri Lanka Insurance Corporation Ltd. –
General Fund |
9,388,488 |
5.68 |
| 4 |
Sri Lanka Insurance Corporation
Ltd. – General Fund |
9,388,488 |
5.68 |
HSBC International Nominees Ltd. –
SNFE – NTAsian Discovery Master Fund |
8,973,856 |
5.43 |
| 5 |
Dr. S Yaddehige |
8,550,285 |
5.18 |
Dr. S Yaddehige |
8,669,000 |
5.25 |
| 6 |
Sri Lanka Insurance Corporation
Ltd. – Life Fund |
7,805,426 |
4.73 |
Sri Lanka Insurance Corporation Ltd. –
Life Fund |
7,805,426 |
4.73 |
| 7 |
Perpetual Treasuries Ltd. |
7,352,180 |
4.45 |
HSBC International Nominees Ltd. –
BPSS LUX – Aberdeen Global Asia Pacific
Equity Fund |
5,715,450 |
3.46 |
| 8 |
Employees Trust Fund Board |
5,714,594 |
3.46 |
Employees’ Trust Fund Board |
5,592,897 |
3.39 |
| 9 |
Softlogic Life Insurance PLC
Account Number 03/Life
Shareholders Fund |
5,024,252 |
3.04 |
R S Captain |
5,326,985 |
3.23 |
| 10 |
SBI Ven Holdings Pte Ltd. |
5,000,000 |
3.03 |
BNY-CF Ruffer Investment Funds:
CF Ruffer Pacific Fund |
4,850,000 |
2.94 |
| 11 |
BNYMSANY Re-CF Ruffer
Investment Funds: CF Ruffer
Pacific Fund |
4,850,000 |
2.94 |
HSBC International Nominees Ltd. –
BP2S London – Aberdeen Asia Pacific
Equity Fund |
4,294,800 |
2.60 |
| 12 |
Hatton National Bank PLC
A/C No 1 |
4,282,200 |
2.59 |
Hatton National Bank PLC – A/C No. 1 |
4,282,200 |
2.59 |
| 13 |
HSBC International Nominees
Ltd.-BBH-Matthews Emerging
Asia Fund |
3,374,293 |
2.04 |
HSBC International Nominees Ltd. –
MSNY-Bay Pond Partners L.P. |
3,464,876 |
2.10 |
| 14 |
A K Pathirage |
2,970,000 |
1.80 |
Asian Alliance Insurance PLC –
A/C No.03 (Life Shareholders' Fund) |
3,450,977 |
2.09 |
| 15 |
Perpetual Equities (Pvt) Ltd. |
2,839,526 |
1.72 |
A K Pathirage |
2,970,000 |
1.80 |
| 16 |
CIC Holdings PLC |
2,462,894 |
1.49 |
HSBC International Nominees Ltd. – BBH-Matthews Emerging Asia Fund |
2,515,196 |
1.52 |
| 17 |
Asiri Central Hospitals Ltd. |
2,403,447 |
1.45 |
Asiri Central Hospitals Ltd. |
2,403,447 |
1.46 |
| 18 |
Softlogic Life Insurance
PLC-A/C 02 (Life Fund) |
2,159,746 |
1.31 |
Asian Alliance Insurance PLC –
A/C No.02 (Life Fund) |
2,159,746 |
1.31 |
| 19 |
DFCC Bank PLC A/C 1 |
2,000,000 |
1.21 |
DFCC Bank PLC A/C No.01 |
2,000,000 |
1.21 |
| 20 |
HSBC International Nominees
Ltd.-BP2S London-Aberdeen
Asia Smaller Companies
Investment Trust |
1,683,000 |
1.02 |
HSBC International Nominees Ltd. –
BP2S London-Aberdeen Asia Smaller
Companies Investment Trust |
1,683,000 |
1.02 |
| |
Total |
123,717,704 |
74.90 |
|
117,927,668 |
71.40 |
5. Public Shareholding
|
2016 |
2015 |
| Percentage of the shares held by the public |
88.89% |
90.30% |
| Number of public shareholders |
8,014 |
7,881 |
6. Directors' Interest in Shares of the Bank
|
As at 31 December 2016 |
As at 31 December 2015 |
|
No. of Shares |
No. of Shares |
| A W Atukorala |
500 |
N/A |
| A K Pathirage |
3,993,000* |
3,993,000* |
| T L F Jayasekera |
Nil |
Nil |
| Mrs. K Fernando |
Nil |
Nil |
| D S P Wikramanayake |
Nil |
Nil |
| Mrs. W A I Sugathadasa |
Nil |
Nil |
| Mrs. D M A Harasgama |
Nil |
Nil |
| D M R Phillips |
Nil |
Nil |
| K D W Ratnayaka |
Nil |
Nil |
| N S Welikala |
Nil |
N/A |
| P L D N Seneviratne (appointed w.e.f. 01/01/2017) |
N/A |
N/A |
* Includes shares held in the slash account.
7. Information on Share Trading
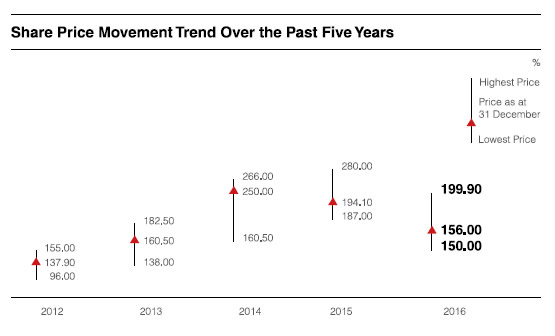
7.1 Share Price Movement Trend Over the Past Five Years
| Year |
2016 |
2015 |
2014 |
2013 |
2012 |
| Highest price |
199.9 |
280 |
266 |
182.50 |
155 |
| Date/s highest price was recorded |
03.05.2016 |
23.07.2015
22.05.2015 |
03.10.2014 |
10.05.2013 |
26.09.2012 |
| Lowest price |
150.00 |
187.00 |
160.50 |
138.00 |
96.00 |
| Date/s lowest price was recorded |
24.11.2016 |
28.12.2015 |
02.01.2014 |
02.01.2013 |
05.06.2012 |
| Price as at 31 December |
156.00 |
194.10 |
250.00 |
160.50 |
137.90 |
| Total number of shares in issue |
165,185,506 |
165,167,342 |
165,093,922 |
164,693,034 |
164,201,902 |
7.1.1 Share Price Movement Over the Year
| 2016 |
Jan. |
Feb. |
Mar. |
Apr. |
May |
Jun. |
Jul. |
Aug. |
Sep. |
Oct. |
Nov. |
Dec. |
| Highest price |
195.00 |
174.00 |
170.00 |
193.00 |
199.90 |
176.50 |
170.00 |
174.00 |
168.00 |
168.90 |
164.00 |
165.00 |
| Lowest price |
165.20 |
164.60 |
150.00 |
170.00 |
175.00 |
168.00 |
164.00 |
163.90 |
163.20 |
161.00 |
150.00 |
152.00 |
| Price as at month end |
170.00 |
164.60 |
168.80 |
193.00 |
176.00 |
169.20 |
164.30 |
164.60 |
166.10 |
161.00 |
153.10 |
156.00 |
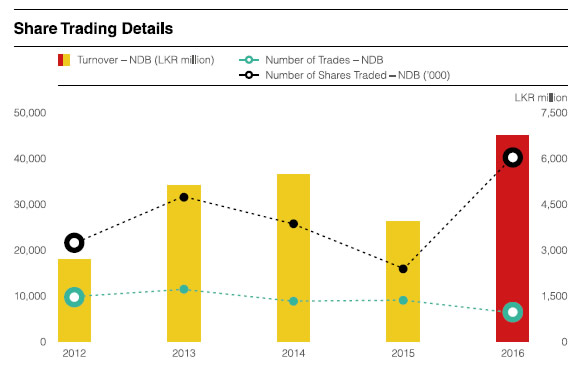
7.2 Share Trading Details
| Year |
2016 |
Q4 |
Q3 |
Q2 |
Q1 |
2015 |
2014 |
2013 |
2012 |
| Number of trades – NDB |
6,356 |
322 |
2,471 |
1,645 |
1,918 |
9,040 |
8,917 |
11,406 |
9,854 |
Percentage of total
market trades |
0.60% |
0.74% |
0.71% |
0.55% |
0.81% |
0.60% |
0.45% |
0.80% |
0.53% |
Number of shares
traded ('000) – NDB |
40,295 |
201 |
24,483 |
11,323 |
4,288 |
15,964 |
25,872 |
31,631 |
21,406 |
Percentage of total shares
traded in the market |
0.56% |
0.05% |
1.07% |
0.70% |
0.20% |
0.17% |
0.15% |
0.22% |
0.22% |
Turnover – NDB
(LKR million) |
6,760 |
32 |
4,052 |
1,961 |
715 |
3,918 |
5,452 |
5,112 |
2,676 |
| Average daily turnover – NDB |
28 |
1 |
66 |
33 |
12 |
16 |
23 |
21 |
11 |
Percentage of total
market turnover |
3.82% |
0.14% |
8.44% |
4.61% |
1.59% |
0.60% |
1.60% |
2.55% |
1.25% |
7.3 Shareholder Funds and Market Capitalization
| Year |
2016 |
2015 |
2014 |
2013 |
2012 |
| Shareholder funds (NDB) in LKR million |
29,937 |
28,382 |
27,876 |
24,514 |
24,883 |
Percentage increase/decrease in shareholder funds
over the prior year |
5% |
2% |
14% |
-1% |
47% |
| Market capitalization (NDB) in LKR million |
25,769 |
32,059 |
41,273 |
26,433 |
22,643 |
Percentage increase/decrease in NDB market capitalization
over the prior year |
-20% |
-22% |
56% |
17% |
0% |
| Market capitalization (CSE) in LKR million |
2,745,406 |
2,937,998 |
3,104,864 |
2,459,897 |
2,167,581 |
Percentage increase/decrease in CSE market capitalization
over the prior year |
-6.56% |
-5.37% |
26.22% |
13.49% |
-2.09% |
NDB's market capitalizaion as a percentage of CSE market
capitalization |
0.94% |
1.09% |
1.33% |
1.07% |
1.04% |
| Market capitalization rank of NDB in the CSE |
25 |
21 |
16 |
20 |
22 |
| Market capitalization (BFI sector within CSE) in LKR million |
653,858 |
699,844 |
753,695 |
512,792 |
490,561 |
NDB's market capitalizaion as a percentage of BFI
sector capitalization |
3.94% |
4.58% |
5.48% |
5.15% |
4.62% |
| Beta value of NDB share against ASPI |
1.36 |
1.37 |
1.11 |
0.82 |
1.17 |
| Beta value of NDB share against S&P SL20 |
0.92 |
1.54 |
1.10 |
0.63 |
1.28 |
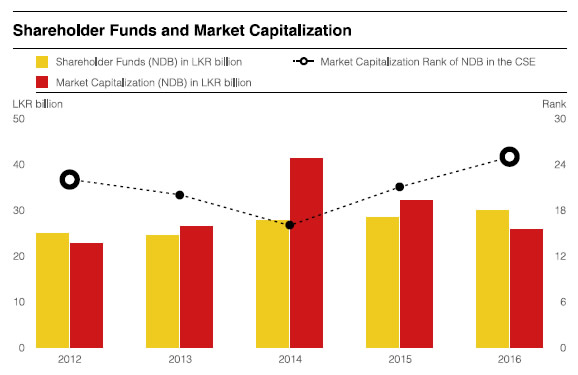
NDB Group’s shareholder’s funds increased by 5% in 2016 and reached LKR 29,937 million. Within shareholder funds, capital and retained earnings increased by 7% and 8% respectively. Other reserves recorded a decline of 50% over 2015 due to Available-for-sale revenues recording losses due to mark to mark valuation, which are deemed to be temporary in a rising interest rate environment.
On a five-year compound annual growth rate spanning end 2011 to end 2016, the shareholder funds have grown at a rate of 12%.
NDB’s market capitalization dropped by 20% and stood at LKR 25,769 million by end 2016, the primary reason for the drop being, the movement of the closing share price of LKR 156.00 in 2016 from LKR 194.10 in 2015.
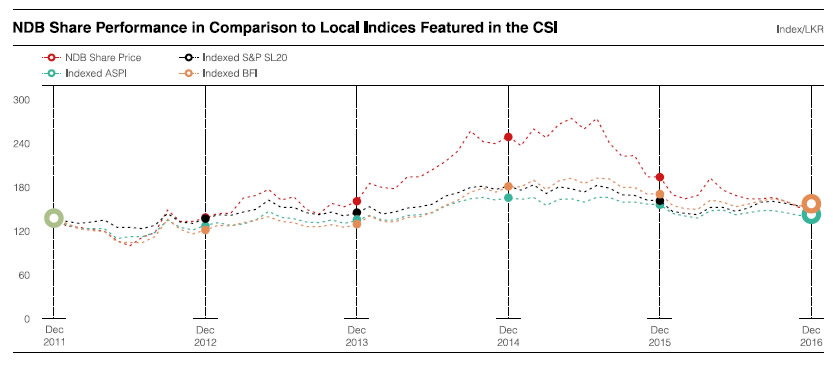
7.4 NDB Share Performance in Comparison to Selected Indices
8. Key Shareholder Return Indicators – NDB Group
Discussion of Each Key Ratio with Graphical Analysis
| Year |
2016 |
2015 |
2014 |
2013 |
2012 |
| Return on equity (%) |
9.23 |
12.59 |
15.78 |
10.7 |
42.35 |
| Gross dividends paid during the year (LKR million) |
654 |
1,815 |
1,987 |
3,222 |
657 |
| Dividend per share (DPS) (LKR) |
8.00 |
11.00 |
11.00 |
10.00 |
15.00 |
| Dividend yield (%) |
5.13 |
5.67 |
4.40 |
6.23 |
10.88 |
| Dividend payout ratio (%) |
49.11 |
51.00 |
43.90 |
62.37 |
79.00 |
| Earnings per share (EPS) (LKR) |
16.29 |
21.51 |
25.14 |
16.48 |
55.31 |
| Total shareholder return ratio (TSR) (%) |
-17.57 |
-17.96 |
63.23 |
30.89 |
2.75 |
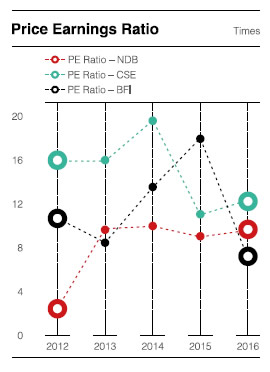
| Price earnings ratio (PE ratio) (Times) |
9.58 |
9.02 |
9.94 |
9.74 |
2.49 |
| Net asset value per share (LKR) |
181.23 |
172.35 |
169.35 |
148.85 |
151.54 |
| Price to book value (Times) |
0.86 |
1.13 |
1.48 |
1.08 |
0.91 |
Return on Equity and Earnings per Share
The Bank’s return on average shareholders' funds (ROE) for the year ended 31 December 2016 was 13.36%. The same measures for the NDB Group were 9.23%. The earnings per share (EPS) of the Bank and the Group were LKR 19.19 and LKR 16.29 respectively.
The reduction in the ROE as well as the EPS over the prior year was due to the reduction in profit attributable to shareholders, which was discussed in length under the Financial Review in pages 42 to 50.
Dividends Policy of the Bank
The Bank’s dividends are governed by a Board approved dividend policy. The policy sets four key conditions in ensuring adequate returns to our shareholders, capital adequacy and sufficient liquidity when declaring dividends to shareholders.
| Ratio |
Policy Guidelines |
| Dividend payout ratio |
>35% |
| Capital adequacy |
>12% |
| Open loan position |
<40% |
| Liquidity |
>20% |
Dividends for the Year
The Bank declared a final and total dividend of LKR 8.00 comprising a cash dividend of LKR 2.00 and a scrip dividend of LKR 6.00 per share for 2016. The dividend declared well met the internally set policy guidelines as was mentioned above.
Total Shareholder Returns
Total shareholder returns (TSR) for the year was a negative 17.57%. The reduction of the share price and lower dividends per share compared to
2015 were the primary causes of the reduced TSR.
Price Earnings Ratio
The price earnings ratio (PE ratio) of 9.58 (times) compared with PE ratios of 12.37 (times) and 7.04 (times) of the CSE and the banking, finance and insurance sector of the CSE.
Price to Book Value
The price to book value (PBV) was 0.86 times (2015: 1.13 times). The reduction in the share price and the increase in the book value per share compared to 2015 led to the lesser than 1 PBV ratio.
Net Assets Value Per Share
This indicator improved from LKR 172.35 in 2015 to LKR 181.23 by end 2016, predominantly due to the 5% increase in the shareholder funds combined with a marginal increase in the share base of the Bank.
9. Employee Share
Ownership Schemes
9.1 Employee Share
Option Scheme (ESOS) and Equity Linked Compensation Plan (ELCP)
The Bank obtained approval of the shareholders at an Extraordinary General Meeting held in March 2016, to enable the management staff in the rank of Senior Manager and above of the Bank and the respective Chief Executive Officers of NDB Capital Holdings Ltd., NDB Wealth Management Ltd., NDB Investment Bank Ltd. and NDB Securities (Private) Limited to take part in the voting ordinary share capital of the Bank, subject to certain limits, terms and conditions, thereby forming an Equity Linked Compensation Plan 2016 (ESOS 2016).
Accordingly, under the ESOS 2016, the Bank will offer Share Options relating to voting shares to the eligible employees up to a maximum of 5% of the total number of shares issued by the Bank. The Scheme shall commence in the year 2017 and would be issued during a period of five years. In each year, the Share Options will be limited to 1.25% of the total number of shares then issued by the Bank.
The ELCP previously approved by the shareholders at an Extraordinary General Meeting held in April 2010 (ELCP – 2010), to enable the management staff in the rank of Assistant Vice-President and above of the Bank to take part in the voting ordinary share capital of the Bank, was concluded in 2014.
However, as per the ELCP 2010, the eligible members of the staff can exercise share options until 2017, and accordingly eligible staff members have exercised share options amounting to 18,164 shares during the year ended 31 December 2016.
The said issue of 18,164 shares resulted in the increase of the stated capital of the Bank from LKR 1,243 million to LKR 1,246 million as at 31 December 2016. The number of shares in issue increased from 165,167,342 to 165,185,506 as at 31 December 2016.
Additionally, the shares issued under Award 4 of the aforementioned ELCP Share Grant component and the balance un-allocated shares remaining from the issue of shares under Award 1 of the ELCP Share Grant component, were transferred to the respective eligible employees during the year 2016, subsequent to the completion of the vesting period and subsequent to obtaining the approval of the Securities and Exchange Commission of Sri Lanka (SEC) for such private transfers. Accordingly, a total number of 573,018 shares were transferred to eligible employees, thus effectively concluding the Share Grant component of the ELCP approved in the year 2010.
More details on the share options and share grants schemes are given on Note 43 on pages 352 and 353 to the Financial Statements.
Debentures
10. NDB has Two Debentures in Issue as follows:
i Listed rated unsecured subordinated redeemable debentures – June 2015
ii Listed rated unsecured subordinated redeemable debentures – December 2013
10.1 Rated Unsecured Subordinated Redeemable Debentures – June 2015
10.1 (A) Key Features of the Debentures
| Types of Debentures |
Debenture Code |
ISIN |
Issue Price LKR |
Par Value LKR |
Interest
Rate Per Annum % |
Interest Payment Frequency |
Annual Effective Rate Per Annum |
Date of
Allotment |
Redemption (From the
Date of Allotment) |
Interest
Payment Dates |
| Type A |
NDB-BD-20.24.06-C2309-9.4 |
LK0207D23091 |
100 |
100 |
9.40 |
Annually |
9.40% |
24.06.2015 |
60 months
(5 years) |
31 December |
| Type B |
NDB-BD-
20.24.06-C2308-0 |
LK0207D23083 |
63.8136 |
100 |
9.40 |
Annual compounding on the Issue Price payable on the Date of Redemption |
9.40% |
24.06.2015 |
60 months
(5 years) |
At the time of redemption |
10.1 (B) Trading Details for the Year Ended 31 December 2016
| Type of Debenture |
CSE Listing |
Interest Payable Frequency |
Balance
as at 31
December
2016
LKR million |
Market Value |
Interest Rate |
Interest
Rate of Comparable
Security % |
Other Ratios as at
Last Trade |
|
|
|
Highest
LKR |
Lowest
LKR |
Quarter
End LKR |
Coupon Rate
% |
Effective Annual
Yield % |
|
Interest
Yield
% |
Yield To Maturity
% |
| Fixed Rate |
|
|
|
|
|
|
|
|
|
|
|
| A – June 2015/June 2020 |
Listed |
Annually |
7,000 |
Not traded during
the year
|
9.40 |
9.19 |
8.30 |
Not traded during
the year |
| B – June 2015/June 2020 |
Listed |
Payable on date of redemption |
1,914 |
Not traded during
the year
|
9.4 annual compounding on
the Issue Price of Rs. 63.8136 |
9.18 |
8.30 |
Not traded during
the year |
| Total Debentures |
|
|
8,914 |
|
|
|
|
|
|
|
|
10.2 Rated Unsecured Subordinated Redeemable Debentures – December 2013
10.2 (A) Key Features of the Debentures
| Types of Debentures |
Debenture Code |
ISIN |
Issue Price
LKR |
Par Value
LKR |
Interest
Rate Per Annum
% |
Interest Payment Frequency |
Annual Effective Rate
Per Annum
% |
Date of
allotment |
Redemption (From the Date of Allotment) |
Interest Payment
Dates |
| Type A |
NDB/BC/19/12/ 18A13 |
LK0207D20998 |
100 |
100 |
13.00 |
Semi-Annually |
13.42 |
19.12.2013 |
60 months (5 years) |
30 June &
31 December |
| Type B |
NDB/BC/19/12/ 18B13.4 |
LK0207D21012 |
100 |
100 |
13.40 |
Annually |
13.40 |
19.12.2013 |
60 months (5 years) |
31 December |
| Type C |
NDB/BC/19/12/ 23C13.9 |
LK0207D21038 |
100 |
100 |
13.90 |
Annually |
13.90 |
19.12.2013 |
120 months (10 years) |
31 December |
| Type D |
NDB/BC/19/12/ 25D14 |
LK0207D21053 |
100 |
100 |
14.00 |
Annually |
14.00 |
19.12.2013 |
144 months (12 years) |
31 December |
10.2 (B) Trading Details for the Year Ended 31 December 2016
| Type of Debenture |
CSE
Listing |
Interest Payable Frequency |
Balance
as at
31 December
2016
LKR Million |
Market Value |
Interest Rate |
Interest
Rate of Comparable
Security
% |
Other Ratios as at
Last Trade |
| Highest
LKR |
Lowest
LKR |
Quarter
End LKR |
Coupon
Rate
% |
Effective
Annual
Yield % |
Interest
Yield
% |
Yield to
Maturity
% |
| Fixed rate |
|
|
|
|
|
|
|
|
|
|
|
| A – Dec, 2013/Dec. 2018 |
Listed |
Semi annually |
1,243 |
100.10 |
99.00 |
99.00 |
13.00 |
12.79 |
8.30 |
13.60 |
13.60 |
| B – Dec. 2013/Dec. 2018 |
Listed |
Annually |
1,529 |
98.50 |
98.50 |
98.50 |
13.40 |
12.77 |
8.30 |
14.15 |
14.15 |
| C – Dec. 2013 Dec. 2023 |
Listed |
Annually |
3,638 |
Not traded during the year |
13.90 |
13.17 |
9.75 |
Not traded during
the year |
| D – Dec. 2013/Dec. 2025 |
Listed |
Annually |
3,590 |
100.36 |
100.36 |
100.36 |
14.00 |
13.26 |
9.75 |
13.93 |
13.93 |
| Total Debentures |
|
|
10,000 |
|
|
|
|
|
|
|
|
11. Information on debentures of the Bank (As per Rule No. 7.6 x (i) of the Listing Rules of the Colombo Stock Exchange (Bank)
|
2016 |
2015 |
| Debt Equity Ratio (%) |
12.11 |
12.19 |
| Interest Cover (Times) |
1.42 |
1.55 |
| Liquidity Assets Ratio (%) – Domestic Banking Unit |
21.50 |
22.24 |
| Liquidity Assets Ratio (%) – Foreign Currency Banking Unit |
22.93 |
24.91 |
12. Directors' Interests in listed Debentures as at 31 December 2016
|
Debenture June 2016 |
Debenture December 2015 |
|
As at 31 December 2016 |
As at 31 December 2015 |
As at 31 December 2016 |
As at 31 December 2015 |
| Name |
No. of Debentures |
No. of Debentures |
No. of Debentures |
No. of Debentures |
| A W Atukorala |
None |
N/A** |
None |
N/A** |
| A K Pathirage |
None |
None |
None |
None |
| T L F Jayasekera |
None |
None |
None |
None |
| Mrs. K Fernando |
None |
None |
None |
None |
| D S P Wikramanayake |
None |
None |
None |
None |
| Mrs. W A I Sugathadasa |
None |
None |
None |
None |
| Mrs. D M A Harasgama |
None |
None |
None |
None |
| D M R Phillips |
None |
None |
None |
None |
| K D W Ratnayaka |
None |
None |
None |
None |
| N S Welikala |
None |
N/A** |
None |
N/A** |
| P L D N Seneviratne |
N/A** |
N/A** |
N/A** |
N/A** |
** Not Directors as at 31 December 2015/16
Credit Ratings
of NDB
13. NDB’s Credit Ratings
NDB at present engages the services
of Fitch Ratings Lanka Ltd. for local credit ratings and the Bank's ratings are as follows:
Revised in June 2016 and affirmed
in January 2017
National long-term rating : A+(lka); Stable outlook
Basel compliant subordinated term debt: A(lka)
Rating history – June 2015
National long-term rating : AA-(lka); Stable outlook
Subordinated term debt: A+(lka)
14. Full Rating Reports
Please refer our Investor Relations web page within the NDB corporate website on www.ndbbank.com to read the full rating reports.
Other Information
15. Financial Statements in USD
15.1 Statement of Profit or Loss
|
Bank |
Group |
| For the year ended 31 December |
2016 |
2015 |
Change |
2016 |
2015 |
Change |
|
USD '000 |
USD '000 |
% |
USD '000 |
USD '000 |
% |
| Gross income |
226,689 |
189,161 |
20 |
230,062 |
196,921 |
17 |
| Interest income |
194,925 |
154,868 |
26 |
197,257 |
156,800 |
26 |
| Less: Interest expenses |
137,116 |
99,837 |
37 |
136,904 |
99,680 |
37 |
| Net interest income |
57,809 |
55,031 |
5 |
60,353 |
57,120 |
6 |
| Fee and commission income |
15,347 |
14,751 |
4 |
20,748 |
23,096 |
(10) |
| Net gains/(losses) from trading |
6,689 |
7,963 |
(16) |
6,689 |
7,963 |
(16) |
| Net gains/(losses) from financial investments |
1,440 |
1,917 |
(25) |
3,002 |
3,612 |
(17) |
| Other operating income |
8,288 |
9,662 |
(14) |
2,366 |
5,450 |
(57) |
| Total operating income |
89,573 |
89,324 |
0 |
93,158 |
97,241 |
(4) |
| Less: Impairment for loans and receivables other losses |
9,311 |
5,208 |
79 |
9,703 |
5,459 |
78 |
| Net operating income |
80,262 |
84,116 |
(5) |
83,455 |
91,782 |
(9) |
| Less: Operating Expenses |
|
|
|
|
|
|
| Personnel expenses |
23,393 |
23,443 |
(0) |
25,832 |
26,584 |
(3) |
| Other expenses |
20,531 |
20,817 |
(1) |
22,929 |
23,384 |
(2) |
| Total operating expenses |
43,924 |
44,260 |
(1) |
48,761 |
49,968 |
(2) |
| Operating profit before tax on financial services |
36,338 |
39,856 |
(9) |
34,694 |
41,814 |
(17) |
| Less: Tax on financial services |
7,138 |
6,661 |
7 |
7,138 |
6,661 |
7 |
| Operating profit after tax on financial services |
29,200 |
33,195 |
(12) |
27,556 |
35,153 |
(22) |
| Share of associate companies' profits/(losses) |
– |
– |
– |
– |
569 |
(100) |
| Profit before taxation |
29,200 |
33,195 |
(12) |
27,556 |
35,722 |
(23) |
| Less: Taxation |
7,606 |
7,506 |
1 |
8,382 |
8,871 |
(6) |
| Profit for the year |
21,594 |
25,689 |
(16) |
19,174 |
26,851 |
(29) |
Profit attributable to equity holders
of the parent |
21,594 |
25,689 |
(16) |
18,330 |
25,914 |
(29) |
| Non Controlling Interests |
– |
– |
– |
844 |
937 |
(10) |
| |
21,594 |
25,689 |
(16) |
19,174 |
26,851 |
(29) |
| Earnings Per Share on Profit |
|
|
|
|
|
|
| Basic Earnings per share (in LKR) |
0.13 |
0.16 |
(9) |
0.11 |
0.16 |
(31) |
| Diluted Earnings per share (in LKR) |
0.13 |
0.16 |
(9) |
0.11 |
0.16 |
(31) |
15.2 Statement of Comprehensive Income
|
Bank |
Group |
| As at 31 December |
2016 |
2015 |
Change |
2016 |
2015 |
Change |
|
USD '000 |
USD '000 |
% |
USD '000 |
USD '000 |
% |
| Profit for the year |
21,594 |
25,689 |
(16) |
19,174 |
26,851 |
(29) |
| Other comprehensive income/(expenses) |
|
|
|
|
|
|
Other comprehensive income/(expenses) to be
reclassified to profit or loss in subsequent period |
|
|
|
|
|
|
Exchange differences on translation of
foreign operations |
– |
– |
– |
51 |
119 |
(57) |
| Gains/(losses) from available-for-sale Investments |
(2,535) |
(2,863) |
11 |
(2,972) |
(2,785) |
(7) |
Deferred tax effect on fair value adjustment of
available-for-sale investment |
94 |
576 |
(84) |
227 |
576 |
(61) |
| Net gains/(losses) on available-for-sale investments |
(2,441) |
(2,287) |
(7) |
(2,745) |
(2,209) |
(24) |
| Gains /(losses) on cash flow hedges |
(368) |
(2,105) |
83 |
(368) |
(2,105) |
83 |
Other comprehensive income/(expenses) not to be
reclassified to profit or loss in subsequent period |
|
|
|
|
|
|
Revaluation of owner occupied portion of
freehold buildings |
– |
– |
– |
143 |
698 |
(80) |
| Actuarial gains/(losses) on defined benefit plans |
(498) |
690 |
(172) |
(542) |
727 |
(175) |
| Deferred tax effect on actuarial gains/(losses) |
72 |
(54) |
233 |
79 |
(54) |
246 |
| Net actuarial gains/(losses) on defined benefit plans |
(426) |
636 |
(167) |
(463) |
673 |
(169) |
Total other comprehensive income for the year,
net of taxes |
(3,235) |
(3,756) |
14 |
(3,382) |
(2,824) |
(20) |
| Total Comprehensive Income for the year |
18,359 |
21,933 |
(16) |
15,792 |
24,027 |
(34) |
| Attributable to: |
|
|
|
|
|
|
| Equity holders of the parent |
18,359 |
21,933 |
(16) |
14,931 |
23,049 |
(35) |
| Non-Controlling Interests |
– |
– |
– |
861 |
978 |
(12) |
| |
18,359 |
21,933 |
(16) |
15,792 |
24,027 |
(34) |
15.3 Statement of Financial Position
|
Bank |
Group |
| As at 31 December |
2016 |
2015 |
Change |
2016 |
2015 |
Change |
|
USD '000 |
USD '000 |
% |
USD '000 |
USD '000 |
% |
| Assets |
|
|
|
|
|
|
| Cash and cash equivalents |
33,501 |
82,094 |
(59) |
34,308 |
82,282 |
(58) |
| Balances with the Central Bank of Sri Lanka |
78,874 |
48,610 |
62 |
78,874 |
48,610 |
62 |
| Placements with banks |
22,011 |
8,011 |
175 |
22,011 |
8,011 |
175 |
| Derivative financial instruments |
10,311 |
13,219 |
(22) |
10,311 |
13,219 |
(22) |
| Financial Assets – held-for-trading |
5,559 |
20,731 |
(73) |
24,443 |
36,316 |
(33) |
| Loans and Receivables to banks |
247 |
713 |
(65) |
247 |
713 |
(65) |
| Loans and Receivables to other customers |
1,519,625 |
1,455,570 |
4 |
1,519,893 |
1,456,011 |
4 |
| Financial investments – loans and receivables |
280,324 |
248,822 |
13 |
293,035 |
259,505 |
13 |
| Financial investments – available-for-sale |
210,281 |
197,927 |
6 |
212,946 |
201,145 |
6 |
| Financial investments – held-to-maturity |
27,621 |
30,812 |
(10) |
33,018 |
39,312 |
(16) |
| Investments – held-for-sale |
124 |
129 |
(4) |
222 |
231 |
(4) |
| Investments in subsidiary companies |
14,124 |
14,612 |
(3) |
– |
– |
– |
| Investments in associate companies |
– |
– |
– |
– |
– |
– |
| Investment property |
– |
– |
– |
11,856 |
11,611 |
2 |
| Intangible assets |
2,457 |
1,668 |
47 |
2,568 |
1,908 |
35 |
| Property, plant & equipment |
13,876 |
14,097 |
(2) |
16,878 |
17,048 |
(1) |
| Other assets |
14,341 |
9,912 |
45 |
13,968 |
14,034 |
(0) |
| Total assets |
2,233,276 |
2,146,927 |
4 |
2,274,578 |
2,189,956 |
4 |
| Liabilities |
|
|
|
|
|
|
| Due to banks |
114,319 |
80,694 |
42 |
114,319 |
80,694 |
42 |
| Derivative financial instruments |
3,169 |
4,439 |
(29) |
3,169 |
4,439 |
(29) |
| Due to other customers |
1,360,925 |
1,284,259 |
6 |
1,358,584 |
1,278,835 |
6 |
| Debt Securities issued and other borrowed funds |
395,416 |
420,332 |
(6) |
395,416 |
420,124 |
(6) |
| Tax liabilities |
5,645 |
3,378 |
67 |
5,691 |
3,639 |
56 |
| Deferred tax liabilities |
5,286 |
4,878 |
8 |
4,972 |
4,950 |
0 |
| Employee benefit liabilities |
2,211 |
1,756 |
26 |
2,635 |
2,064 |
28 |
| Other liabilities |
51,302 |
53,617 |
(4) |
52,944 |
55,110 |
(4) |
| Subordinated term debts |
129,816 |
135,930 |
(4) |
129,816 |
135,930 |
(4) |
| Total liabilities |
2,068,089 |
1,989,283 |
4 |
2,067,546 |
1,985,785 |
4 |
| Equity |
|
|
|
|
|
|
| Capital |
8,321 |
8,630 |
(4) |
8,321 |
8,076 |
3 |
| Statutory reserve fund |
8,321 |
8,630 |
(4) |
8,321 |
8,630 |
(4) |
| Retained earnings |
146,157 |
135,030 |
8 |
179,883 |
173,444 |
4 |
| Other reserves |
2,388 |
5,354 |
(55) |
3,319 |
6,948 |
(52) |
| Total equity to equity holders of the Bank |
165,187 |
157,644 |
5 |
199,844 |
197,098 |
1 |
| Non-controlling interests |
– |
– |
|
7,188 |
7,073 |
2 |
| Total equity |
165,187 |
157,644 |
5 |
207,032 |
204,171 |
1 |
| Total liabilities and total equity |
2,233,276 |
2,146,927 |
4 |
2,274,578 |
2,189,956 |
4 |
| Commitments and contingencies |
1,563,558 |
1,651,031 |
(5) |
1,569,629 |
1,656,872 |
(5) |
16. Interim Financial Performance
16.1 Statement of Profit or Loss
|
2016 |
2015 |
| BANK
LKR '000 |
Quarter 4 |
Quarter 3 |
Quarter 2 |
Quarter 1 |
Quarter 4 |
Quarter 3 |
Quarter 2 |
Quarter 1 |
| Net Interest Income |
2,243,419 |
2,204,438 |
2,060,538 |
1,978,917 |
2,015,765 |
1,843,930 |
1,741,914 |
1,920,215 |
| Other operating income |
1,568,275 |
881,682 |
809,701 |
1,403,833 |
966,482 |
1,141,910 |
868,296 |
1,710,776 |
| Total Operating Income |
3,811,694 |
3,086,120 |
2,870,239 |
3,382,750 |
2,982,247 |
2,985,840 |
2,610,210 |
3,630,991 |
Less: Impairment for loans
receivables and other losses |
384,229 |
153,456 |
292,076 |
537,193 |
194,664 |
318,872 |
261,799 |
(63,502) |
| Net operating income |
3,427,465 |
2,932,664 |
2,578,163 |
2,845,557 |
2,787,583 |
2,666,968 |
2,348,411 |
3,694,493 |
| Less: Operating expenses |
1,624,721 |
1,640,550 |
1,616,026 |
1,567,547 |
1,544,024 |
1,556,793 |
1,543,338 |
1,405,424 |
| Profit Before Taxation |
1,802,744 |
1,292,114 |
962,137 |
1,278,010 |
1,243,559 |
1,110,175 |
805,073 |
2,289,069 |
| Less: Taxation |
646,443 |
553,179 |
484,412 |
480,699 |
395,004 |
450,310 |
359,636 |
731,494 |
| Profit for the period |
1,156,301 |
738,935 |
477,725 |
797,311 |
848,555 |
659,865 |
445,437 |
1,557,575 |
| Profit Attributable to: |
|
|
|
|
|
|
|
|
| Equity Holders of the parent |
1,156,301 |
738,935 |
477,725 |
797,311 |
848,555 |
659,865 |
445,437 |
1,557,575 |
| Non-Controlling Interests |
– |
– |
– |
– |
– |
– |
– |
– |
| |
1,156,301 |
738,935 |
477,725 |
797,311 |
848,555 |
659,865 |
445,437 |
1,557,575 |
| Basic Earnings per share (in LKR) |
7.00 |
4.47 |
2.89 |
4.83 |
5.14 |
4.00 |
2.70 |
9.43 |
| Effective Tax rate (%) |
35.86 |
42.81 |
50.35 |
37.61 |
31.76 |
40.56 |
44.67 |
31.96 |
|
2016 |
2015 |
| GROUP
LKR '000 |
Quarter 4 |
Quarter 3 |
Quarter 2 |
Quarter 1 |
Quarter 4 |
Quarter 3 |
Quarter 2 |
Quarter 1 |
| Net Interest Income |
2,328,677 |
2,297,787 |
2,169,853 |
2,064,449 |
2,102,096 |
1,902,158 |
1,819,330 |
1,983,792 |
| Other operating income |
1,368,243 |
1,159,120 |
1,006,897 |
1,282,041 |
1,576,221 |
1,574,655 |
1,175,198 |
1,157,857 |
| Total Operating Income |
3,696,920 |
3,456,907 |
3,176,750 |
3,346,490 |
3,678,317 |
3,476,813 |
2,994,528 |
3,141,649 |
Less: Impairment for loans
receivables and other losses |
374,700 |
171,008 |
332,943 |
545,923 |
201,187 |
327,339 |
281,121 |
(63,502) |
| Net operating income |
3,322,220 |
3,285,899 |
2,843,807 |
2,800,567 |
3,477,130 |
3,149,474 |
2,713,407 |
3,205,151 |
| Less: Operating expenses |
1,831,290 |
1,826,287 |
1,778,713 |
1,722,663 |
1,803,152 |
1,746,450 |
1,718,962 |
1,561,316 |
| Profit from Operations |
1,490,930 |
1,459,612 |
1,065,094 |
1,077,904 |
1,673,978 |
1,403,024 |
994,445 |
1,643,835 |
| Share of associate companies' profit/(losses) |
– |
– |
– |
– |
– |
14,898 |
15,957 |
46,963 |
| Profit Before Taxation |
1,490,930 |
1,459,612 |
1,065,094 |
1,077,904 |
1,673,978 |
1,417,922 |
1,010,402 |
1,690,798 |
| Less: Taxation |
699,300 |
561,999 |
509,539 |
507,748 |
332,582 |
562,332 |
426,887 |
801,204 |
| Profit for the period |
791,630 |
897,613 |
555,555 |
570,156 |
1,341,396 |
855,590 |
583,515 |
889,594 |
| Profit Attributable to: |
|
|
|
|
|
|
|
|
| Equity Holders of the parent |
726,070 |
881,977 |
535,433 |
547,528 |
1,254,438 |
843,797 |
574,531 |
869,275 |
| Non-Controlling Interests |
65,560 |
15,636 |
20,122 |
22,628 |
86,958 |
11,792 |
8,985 |
20,319 |
| |
791,630 |
897,613 |
555,555 |
570,156 |
1,341,396 |
855,589 |
583,516 |
889,595 |
| Basic Earnings per share (in LKR) |
4.40 |
5.34 |
3.24 |
3.33 |
7.62 |
5.13 |
3.49 |
5.28 |
| Effective Tax rate (%) |
46.90 |
38.50 |
47.84 |
47.11 |
19.87 |
39.66 |
42.25 |
47.39 |
16.2 Statement of Financial Position
BANK
LKR '000 |
As at
31/12/2016 |
As at
30/9/2016 |
As at
30/6/2016 |
As at
31/3/2016 |
As at
31/12/2015 |
As at
30/9/2015 |
As at
30/6/2015 |
As at
31/3/2015 |
| Cash and cash equivalents |
20,130,977 |
26,723,081 |
19,647,159 |
23,008,322 |
19,975,020 |
17,543,429 |
22,411,605 |
23,582,507 |
| Net Loans and Advances |
227,676,876 |
222,241,637 |
220,464,118 |
215,736,673 |
209,704,701 |
192,527,763 |
181,435,628 |
175,633,823 |
| Investments |
80,597,222 |
72,632,950 |
67,942,445 |
66,224,434 |
73,876,706 |
62,113,872 |
61,414,034 |
58,134,409 |
| Other Assets |
6,139,657 |
5,720,208 |
6,277,980 |
7,318,040 |
5,601,178 |
6,384,483 |
5,667,489 |
6,822,165 |
| Total |
334,544,732 |
327,317,876 |
314,331,702 |
312,287,469 |
309,157,605 |
278,569,547 |
270,928,756 |
264,172,904 |
| Customer Deposits |
203,866,547 |
193,642,483 |
190,837,894 |
196,903,356 |
184,933,230 |
169,341,944 |
170,094,950 |
162,760,544 |
| Borrowings |
95,804,708 |
101,803,282 |
93,116,971 |
84,862,163 |
91,721,730 |
75,767,555 |
69,648,348 |
70,632,546 |
| Other Liabilities |
10,128,428 |
7,404,401 |
7,192,736 |
8,136,007 |
9,801,788 |
9,616,638 |
7,575,200 |
7,604,820 |
| Shareholders' Funds |
24,745,049 |
24,467,710 |
23,184,101 |
22,385,943 |
22,700,857 |
23,843,410 |
23,610,258 |
23,174,994 |
| Total |
334,544,732 |
327,317,876 |
314,331,702 |
312,287,469 |
309,157,605 |
278,569,547 |
270,928,756 |
264,172,904 |
| Net Asset Value |
149.80 |
137.44 |
140.24 |
135.54 |
137.44 |
144.36 |
142.95 |
140.37 |
| GROUP LKR '000 |
As at 31/12/2016 |
As at 30/9/2016 |
As at 30/6/2016 |
As at 31/3/2016 |
As at 31/12/2015 |
As at 30/9/2015 |
As at 30/6/2015 |
As at 31/3/2015 |
| Cash and cash equivalents |
20,251,928 |
26,851,379 |
19,651,235 |
23,200,708 |
20,002,092 |
17,719,697 |
22,603,704 |
23,791,534 |
| Net Loans and Advances |
227,716,971 |
222,268,482 |
220,490,633 |
215,737,783 |
209,768,193 |
192,528,547 |
181,469,407 |
175,659,497 |
| Investments |
84,436,802 |
76,359,458 |
71,976,538 |
70,162,269 |
77,257,188 |
66,234,659 |
64,452,825 |
61,380,473 |
| Other Assets |
8,326,066 |
8,715,345 |
8,757,470 |
9,850,891 |
8,326,260 |
8,227,970 |
8,315,231 |
9,164,418 |
| Total |
340,731,767 |
334,194,664 |
320,875,876 |
318,951,651 |
315,353,733 |
284,710,873 |
276,841,167 |
269,995,922 |
| Customer Deposits |
203,515,828 |
193,348,373 |
190,447,984 |
196,510,148 |
184,152,280 |
169,039,614 |
169,721,436 |
162,427,534 |
| Borrowings |
95,804,708 |
101,803,282 |
93,116,971 |
84,903,033 |
91,691,730 |
75,737,556 |
69,618,348 |
70,602,547 |
| Other Liabilities |
10,397,934 |
7,931,796 |
7,629,975 |
8,698,974 |
10,109,006 |
9,877,556 |
7,889,172 |
7,912,640 |
| Shareholders’ Funds |
29,936,588 |
30,083,207 |
28,659,549 |
27,796,707 |
28,382,204 |
29,113,108 |
28,684,521 |
28,098,021 |
| Non-Controlling Interests |
1,076,709 |
1,028,006 |
1,021,397 |
1,042,789 |
1,018,513 |
943,039 |
927,690 |
955,180 |
| Total |
340,731,767 |
334,194,664 |
320,875,876 |
318,951,651 |
315,353,733 |
284,710,873 |
276,841,167 |
269,995,922 |
| Net Asset Value |
181.23 |
172.45 |
173.40 |
168.80 |
172.35 |
176.79 |
174.19 |
170.70 |
17. Ten Years at a Glance (Group Performance)
17.1 Statement of Profit or Loss
| LKR million |
2006 |
2007 |
2008 |
2009 |
2010 |
2011 |
2012 |
2013 |
2014 |
2,015 |
2016 |
| Income |
|
|
|
|
|
|
|
|
|
|
|
| Net Interest Income |
2,853 |
3,522 |
3,787 |
4,233 |
4,163 |
4,910 |
5,896 |
7,012 |
7,913 |
7,807 |
8,861 |
| Other Income |
2,133 |
1,474 |
1,662 |
2,560 |
2,785 |
3,012 |
9,042 |
4,537 |
5,053 |
5,484 |
4,816 |
| Total Operating Income |
4,986 |
4,996 |
5,449 |
6,793 |
6,948 |
7,922 |
14,938 |
11,549 |
12,966 |
13,291 |
13,677 |
Less: Impairment for loans and
receivables and other losses |
13 |
65 |
116 |
373 |
(172) |
(88) |
51 |
1,261 |
529 |
746 |
1,425 |
| Net Operating Income |
4,973 |
4,932 |
5,333 |
6,420 |
7,120 |
8,010 |
14,887 |
10,288 |
12,437 |
12,545 |
12,252 |
| Less Operating Expenses |
|
|
|
|
|
|
|
|
|
|
|
| Personnel Expenses |
830 |
949 |
1,151 |
1,300 |
1,567 |
2,118 |
2,333 |
2,660 |
3,172 |
3,634 |
3,793 |
| Other Expenses |
929 |
1,104 |
1,237 |
1,370 |
1,496 |
1,863 |
2,163 |
2,904 |
2,738 |
3,196 |
3,366 |
| Total Operating Expenses |
1,759 |
2,053 |
2,388 |
2,670 |
3,063 |
3,981 |
4,496 |
5,564 |
5,910 |
6,830 |
7,159 |
| |
|
|
|
|
|
|
|
|
|
|
|
Operating Profit Before
Share of Associate
Companies, Profit Before Tax |
3,213 |
2,879 |
2,945 |
3,750 |
4,056 |
4,030 |
10,391 |
4,724 |
6,527 |
5,715 |
5,094 |
Share of Associate
Company's Profit/(Losses) |
214 |
179 |
172 |
526 |
295 |
331 |
439 |
49 |
97 |
78 |
– |
| Profit Before Taxation |
3,427 |
3,058 |
3,117 |
4,276 |
4,351 |
4,361 |
10,830 |
4,773 |
6,624 |
5,793 |
5,094 |
| Less: Taxation |
1,220 |
1,421 |
1,409 |
2,154 |
2,175 |
1,597 |
1,898 |
2,061 |
2,378 |
2,123 |
2,279 |
| Profit for the Year |
2,207 |
1,637 |
1,708 |
2,122 |
2,176 |
2,764 |
8,932 |
2,712 |
4,246 |
3,670 |
2,815 |
| Non controlling Interest |
(176) |
(115) |
(103) |
(37) |
(73) |
(235) |
(78) |
(70) |
(112) |
(128) |
(124) |
| Profit Attributable to equity holders of the parent |
2,031 |
1,522 |
1,605 |
2,085 |
2,103 |
2,529 |
8,854 |
2,642 |
4,134 |
3,542 |
2,691 |
17.2 Group – Statement of Financial Position
| LKR million |
2006 |
2007 |
2008 |
2009 |
2010 |
2011 |
2012 |
2013 |
2014 |
2015 |
2016 |
| Assets |
|
|
|
|
|
|
|
|
|
|
|
| Liquid assets |
6,042 |
7,748 |
5,883 |
8,243 |
5,586 |
7,651 |
13,269 |
8,139 |
12,737 |
20,002 |
20,252 |
| Investments |
12,170 |
14,701 |
18,509 |
32,128 |
20,021 |
27,359 |
32,499 |
55,614 |
72,971 |
77,257 |
84,437 |
| Loans and Receivables |
42,418 |
49,818 |
54,589 |
54,107 |
78,452 |
102,019 |
124,311 |
137,523 |
175,547 |
209,768 |
227,717 |
| Investments in Associate Companies |
1,179 |
1,210 |
1,393 |
1,724 |
1,763 |
1,797 |
33 |
77 |
– |
– |
– |
| Property, Plant & Equipment |
691 |
804 |
781 |
806 |
918 |
1,504 |
1,541 |
1,473 |
2,550 |
2,730 |
2,913 |
| Investment Property |
1,200 |
1,200 |
1,200 |
1,200 |
1,200 |
1,296 |
1,296 |
1,384 |
1,546 |
1,672 |
1,776 |
| Other Assets |
1,277 |
662 |
925 |
1,075 |
691 |
962 |
1,154 |
2,608 |
3,780 |
3,925 |
3,637 |
| Goodwill |
– |
– |
– |
4 |
4 |
– |
|
|
– |
– |
– |
| Total Assets |
64,977 |
76,143 |
83,281 |
99,287 |
108,635 |
142,588 |
174,103 |
206,818 |
269,130 |
315,354 |
340,732 |
| Liabilities |
|
|
|
|
|
|
|
|
|
|
|
| Borrowings |
29,204 |
34,147 |
34,993 |
29,561 |
28,631 |
38,973 |
36,630 |
47,344 |
80,768 |
92,331 |
96,279 |
| Deposits with customers |
21,161 |
25,624 |
31,091 |
49,948 |
60,533 |
82,094 |
107,394 |
129,423 |
151,485 |
184,152 |
203,516 |
| Taxation |
640 |
522 |
352 |
560 |
633 |
397 |
713 |
625 |
1,416 |
1,237 |
1,597 |
| Other Liabilities |
2,091 |
2,750 |
3,614 |
4,334 |
2,826 |
3,286 |
3,657 |
4,062 |
6,662 |
8,233 |
8,326 |
| Total Liabilities |
53,096 |
63,043 |
70,050 |
84,403 |
92,623 |
124,750 |
148,394 |
181,454 |
240,331 |
285,953 |
309,718 |
| Shareholders' Funds |
|
|
|
|
|
|
|
|
|
|
|
| Capital |
1,033 |
1,033 |
1,033 |
1,033 |
864 |
864 |
864 |
944 |
1,145 |
1,163 |
1,246 |
| Statutory Reserve Fund |
819 |
819 |
819 |
819 |
879 |
879 |
879 |
959 |
1,011 |
1,243 |
1,246 |
| Other Reserves |
– |
– |
– |
– |
– |
387 |
924 |
1,880 |
1,474 |
1,000 |
497 |
| Retained Earnings |
8,715 |
9,833 |
10,811 |
12,345 |
13,552 |
14,796 |
2,221 |
20,733 |
24,246 |
24,976 |
26,947 |
Total equity attributable to equity
holders of the Bank |
10,567 |
11,685 |
12,663 |
14,197 |
15,295 |
16,926 |
24,883 |
24,516 |
27,876 |
28,382 |
29,936 |
| Minority non-controlling Interest |
1,314 |
1,415 |
568 |
687 |
717 |
913 |
826 |
848 |
923 |
1,019 |
1077 |
| Total Equity |
11,881 |
13,100 |
13,231 |
14,884 |
16,012 |
17,839 |
25,709 |
25,364 |
28,799 |
29,401 |
31,013 |
| Total Liabilities & Equity |
64,977 |
76,143 |
83,281 |
99,287 |
108,635 |
142,588 |
174,103 |
206,818 |
269,130 |
315,354 |
340,732 |
17.3 Share Information
| |
2006 |
2007 |
2008 |
2009 |
2010 |
2011 |
2012 |
2013 |
2014 |
2,015 |
2016 |
| Share Information |
|
|
|
|
|
|
|
|
|
|
|
| Market price per share (LKR) |
201.00 |
170.00 |
86.00 |
206.00 |
174.50 |
138.10 |
138.10 |
161.50 |
250.00 |
194.10 |
156.00 |
| Basic Earnings per share (LKR) |
12.40 |
9.30 |
9.80 |
12.75 |
12.81 |
15.79 |
55.31 |
16.48 |
25.14 |
21.51 |
16.29 |
| Interim Dividends per share (LKR) |
– |
– |
– |
– |
4.00 |
3.50 |
5.00 |
5.00 |
7.00 |
7.00 |
– |
| Final Dividends per share (LKR) |
4.00 |
6.00 |
6.75 |
8.00 |
4.50 |
4.00 |
10.00 |
5.00 |
4.00 |
4.00 |
8.00 |
| Total Dividends per share (LKR) |
4.00 |
6.00 |
6.75 |
8.00 |
8.50 |
7.50 |
15.00 |
10.00 |
11.00 |
11.00 |
8.00 |
| Dividend cover (Times) |
6.20 |
3.72 |
3.27 |
3.77 |
2.19 |
2.05 |
3.69 |
1.65 |
2.29 |
1.93 |
2.40 |
| Price earnings ratio (Times) |
8.10 |
9.14 |
4.39 |
8.08 |
13.63 |
8.97 |
2.56 |
9.74 |
9.94 |
9.02 |
9.58 |
| Book value per share (LKR) |
64.54 |
71.38 |
77.35 |
86.72 |
93.15 |
103.08 |
151.54 |
148.85 |
169.35 |
172.35 |
181.23 |
18. Compliance Report in Terms of Section 7.6 – Contents of the Annual Report in Terms of the Listing Rules of the Colombo Stock Exchange
Tabulated below, is how we complied with the Contents of the Annual Report, as specified in Section 7.6 of the Listing Rules issued by the Colombo Stock Exchange. The table provides the disclosure requirements of Section 7.6, the compliance level of the Bank and where you will find the respective disclosures within this Annual Report.
| Rule No. |
Disclosure Requirement |
Cross Reference/within the Report (page/s) |
| 7.6 (i) |
Names of persons, who during the financial year, were Directors of the Entity |
192 to 203 |
| 7.6 (ii) |
Principal activities of the Entity and its subsidiaries during the year and any changes therein |
296 |
| 7.6 (iii) |
The names and the number of shares held by the 20 largest holders of voting and non-voting shares and the percentage of such shares held |
134 |
| 7.6 (iv) |
The Public Holding percentage |
135 |
| 7.6 (v) |
A statement of each Director’s holding and Chief Executive Officer’s holding in shares of the Entity
at the beginning and end of the financial year |
135 |
| 7.6 (vi) |
Information pertaining to material foreseeable risk factors of the Entity |
151 to 185 |
| 7.6 (vii) |
Details of material issues pertaining to employees and industrial relations of the Entity |
257 |
| 7.6 (viii) |
Extents, locations, valuations and the number of buildings of the Entity’s land holdings and investment properties |
Note 32 to 34 on pages 333 to 339 |
| 7.6 (ix) |
Number of shares representing the Entity’s stated capital |
Note 43 on page 352 |
| 7.6 (x) |
A distribution schedule of the number of holders in each class of equity securities, and the percentage of their total holdings in the following categories – No. of Holders/Holdings/Total Holdings%- 1-1000 shares/1,001-10,000 shares/10,001-100,000 shares/100,001-1,000,000 shares/ Over 1,000,000 shares) |
133 and 134 |
| 7.6 (xi) |
Ratios and Market Price Information |
|
| |
- Equity: Dividend per share, Dividend payout, Net asset value per share, Market value per share (highest and lowest values recorded during the financial year and value as at the end of financial year)
|
128 to 142 |
| |
- Debt: Interest rate of comparable Government Security, debt/equity ratio, Interest cover, quick assets ratio, market prices and yield during the year (ex-interest) – Highest Price/Lowest Price/Last traded price
|
128 to 142 |
| |
- Any changes in the credit rating (for the entity or any other instruments issued by the entity),
if applicable
|
142 |
| 7.6 (xii) |
Significant changes in the Entity's or its subsidiaries fixed assets and the market value of land, if the value differs substantially from the book value |
Note 32 to 34 on pages 333 to 339 |
| 7.6 (xiii) |
Details of the funds raised either through a public issue, Rights Issue or private placement: |
|
| |
- A statement as to the manner in which the proceeds of such issue has been utilized.
|
254 |
| |
- If any shares or debentures have been issued, the number, class and consideration received, and the reason for the issue, and
|
254 |
| |
- Any material change in the use of funds raised through an issue of Securities
|
254 |
| 7.6 (xiv) |
Employee share option scheme details |
Note 43 to pages 352 and 353 |
| |
Employee share purchase schemes |
N/A |
| 7.6 (xv) |
Disclosures pertaining to Corporate Governance practices in terms of Rules 7.10.3, 7.10.5 c. and 7.10.6 c. of Section 7 of the Rules |
The Bank is exempted from section 7.10 of
the CSE Listing Rules thus N/A |
| 7.6 (xvi) |
Related party transactions exceeding 10% of the Equity or 5% of the total assets of the Entity as per Audited Financial Statements, whichever is lower |
N/A |
19. Shareholder Enquiries and Communications
Investor Relations Team
Mrs. Suvendrini Muthukumarana
Assistant Vice-President – Finance and Planning
Tel.: + 94 112 448 448 / Ext. 3817
Fax: + 94 112 341 047
Email: investor.relations@ndbbank.com
Company Secretarial Division
Mrs. Shehani Ranasinghe
Company Secretary
Tel.: + 94 112 448 448 / Ext. 33000
Fax: + 94 112 341 050
Email: shehani.ranasinghe@ndbbank.com
Address:
National Development Bank PLC,
No. 40, Navam Mawatha,
Colombo 02,
Sri Lanka.