Financial Highlights
|
Bank |
Group |
|
2016 |
2015 |
Change |
2016 |
2015 |
Change |
|
LKR '000 |
LKR '000 |
% |
LKR '000 |
LKR '000 |
% |
| Operating results for the year |
|
|
|
|
|
|
| Gross income |
33,281,736 |
25,855,311 |
29 |
33,776,905 |
26,915,863 |
25 |
| Operating profit before tax on financial services |
5,335,004 |
5,447,875 |
(2) |
5,093,546 |
5,715,283 |
(11) |
| Taxation |
2,164,733 |
1,936,444 |
12 |
2,278,587 |
2,123,006 |
7 |
| Profit for the year |
3,170,271 |
3,511,431 |
(10) |
2,814,959 |
3,670,095 |
(23) |
| Profit attributable to equity holders of the parent |
3,170,271 |
3,511,431 |
(10) |
2,691,014 |
3,542,040 |
(24) |
| Gross dividends for the year |
1,321,484 |
1,816,841 |
(27) |
1,321,484 |
1,816,841 |
(27) |
| Revenue to government |
2,219,013 |
2,572,872 |
(14) |
2,416,656 |
2,862,048 |
(16) |
| Assets and liabilities |
|
|
|
|
|
|
| Due to other customers |
203,866,547 |
184,933,230 |
10 |
203,515,828 |
184,152,280 |
11 |
| Loans and receivables |
227,676,876 |
209,704,701 |
9 |
227,716,971 |
209,768,193 |
9 |
| Total assets |
334,544,735 |
309,157,605 |
8 |
340,731,768 |
315,353,733 |
8 |
| Total liabilities |
309,799,685 |
286,456,747 |
8 |
309,718,472 |
285,953,016 |
8 |
| Total equity to equity holders of the Bank |
24,745,050 |
22,700,858 |
9 |
29,936,587 |
28,382,204 |
5 |
| Profitability (%) |
|
|
|
|
|
|
| Net interest margin |
2.64 |
2.63 |
0 |
2.70 |
2.67 |
1 |
| Non-performing loans ratio |
2.63 |
2.43 |
8 |
2.63 |
2.43 |
8 |
| Return on assets |
0.99 |
1.23 |
(20) |
0.82 |
1.21 |
(32) |
| Return on equity |
13.36 |
15.63 |
(15) |
9.23 |
12.59 |
(27) |
| Total leverage (times) |
13.52 |
13.62 |
(1) |
11.38 |
11.11 |
2 |
| Cost to income ratio |
49.04 |
49.55 |
(1) |
52.34 |
51.39 |
2 |
| Investor Information (LKR) |
|
|
|
|
|
|
| Net asset value per share |
149.80 |
137.44 |
9 |
181.23 |
172.35 |
5 |
| Market value per share – as at 31 December |
156.00 |
194.10 |
(20) |
NA |
NA |
– |
| Earnings per share – basic |
19.19 |
21.26 |
(10) |
16.29 |
21.51 |
(24) |
| Earnings per share – diluted |
19.19 |
21.26 |
(10) |
16.29 |
21.51 |
(24) |
| Price earnings (times) |
8.13 |
9.13 |
(11) |
NA |
NA |
– |
| Dividend per share |
8.00 |
11.00 |
(27) |
NA |
NA |
– |
| Dividend cover (times) |
2.40 |
1.93 |
24 |
NA |
NA |
– |
| Dividend yield (%) |
5.13 |
5.67 |
(10) |
NA |
NA |
– |
| Market capitalisation (LKR' 000) |
25,768,939 |
32,058,981 |
(20) |
NA |
NA |
– |
| Regulatory ratios (%) |
|
|
|
|
|
|
| Capital adequacy ratios: |
|
|
|
|
|
|
| Tier I – (minimum ratio of 5%) |
9.31 |
8.51 |
9 |
11.55 |
11.07 |
4 |
| Tier I & II – (minimum ratio of 10%) |
12.95 |
12.59 |
3 |
15.27 |
15.25 |
0 |
| Statutory liquid assets ratio: |
|
|
|
|
|
|
| DBU |
21.50 |
22.24 |
(3) |
N/A |
N/A |
– |
| FCBU |
22.93 |
24.91 |
(8) |
N/A |
N/A |
– |
Profitability & Growth
- ROE of 13.36%
- Loans and receivables growth of 9%
- Due to other customers growth of 10%
Investor Information
- Dividend per share of LKR 8/-
- Market capitalization rank of 25 in the CSE
Regulatory ratios
- CAR of 12.95%
- Liquidity levels above 20%
Financial Goals and Achievements
|
Goals |
Achievements |
|
|
2016 |
2015 |
2014* |
2013* |
2012 |
|
|
LKR '000 |
LKR '000 |
LKR '000 |
LKR '000 |
LKR '000 |
| Financial indicators – Bank |
|
|
|
|
|
|
| Return on assets (%) |
Over 1.5% |
0.99 |
1.23 |
1.47 |
1.14 |
1.94 |
| Return on equity (%) |
Over 17% |
13.36 |
15.63 |
16.33 |
14.38 |
21.17 |
| Growth in total operating income (%) |
Over 20% |
7.71 |
4.69 |
19.00 |
11.55 |
31.00 |
| Growth in profit after taxation (%) |
Over 20% |
(9.72) |
2.73 |
64.00 |
(29.00) |
60.00 |
| Growth in total assets (%) |
Over 20% |
8.21 |
17.67 |
31.00 |
23.00 |
18.00 |
| Dividend per share (LKR) |
Over 10 |
8.00 |
11.00 |
11.00 |
10.00 |
15.00 |
| Capital adequacy ratios: |
|
|
|
|
|
|
| Tier I (%) – Minimum requirement 5% |
Over 8% |
9.31 |
8.51 |
10.09 |
12.05 |
11.14 |
| Tier I & II (%) – Minimum requirement (10%) |
Over 13% |
12.95 |
12.59 |
14.68 |
17.87 |
12.38 |
*The above achievements are presented excluding the one-off equity income of LKR 6,031 million for the year 2013.
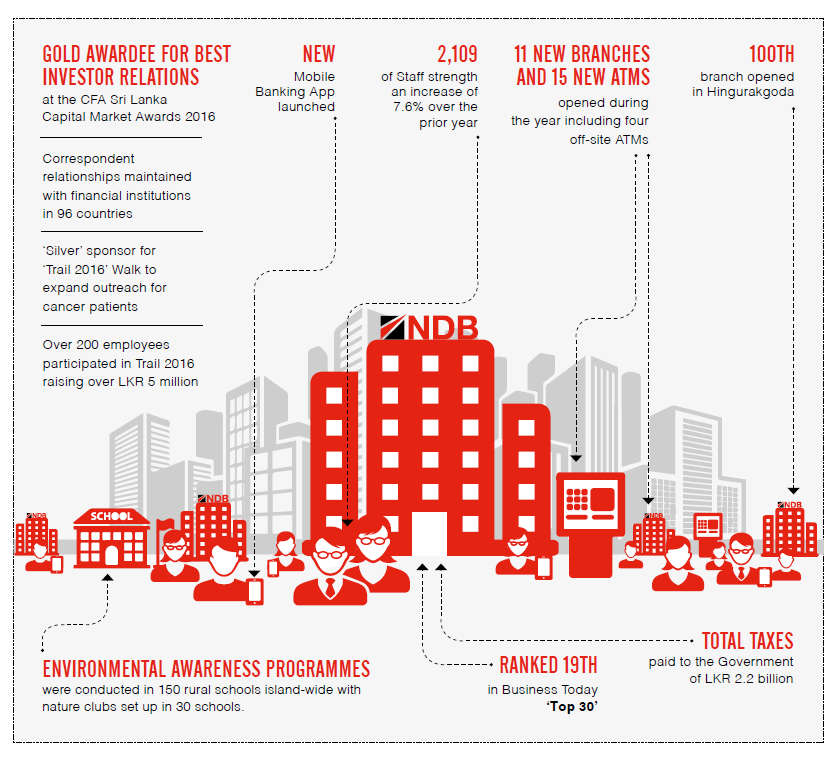
Operational Highlights